

1.3 Finding your way around
SpatiumDDI has a screen for almost everything a network team touches, from subnets to certificates, but you’ll spend most days in three of them. This module shows you how the interface is organized, how to tell at a glance whether the platform is healthy, and how to reach any page or object in a couple of keystrokes. There’s no lab: explore your own lab as you read.
What you’ll learn
Section titled “What you’ll learn”- Read the dashboard tabs, and use Platform Health as your first check when something feels wrong
- Find any screen from the sidebar, which groups pages by job
- Jump to pages and objects with the command palette, and list every shortcut with
? - Explain why a new installation shows only some feature modules, and predict what disappears when you switch one off
- Find the API documentation, and know why it asks you to sign in
Watch it, then try it
Section titled “Watch it, then try it”The video tours the dashboard, the sidebar, the command palette, the shortcuts overlay, the feature modules and the header tools. The walkthrough repeats the clicks. Explore freely, but leave every feature switch as it is.
Transcript
0:00Module 1.3: finding your way around. You'll learn the layout of the dashboard and sidebar, jump anywhere with the command palette, and see how feature modules keep the interface focused.
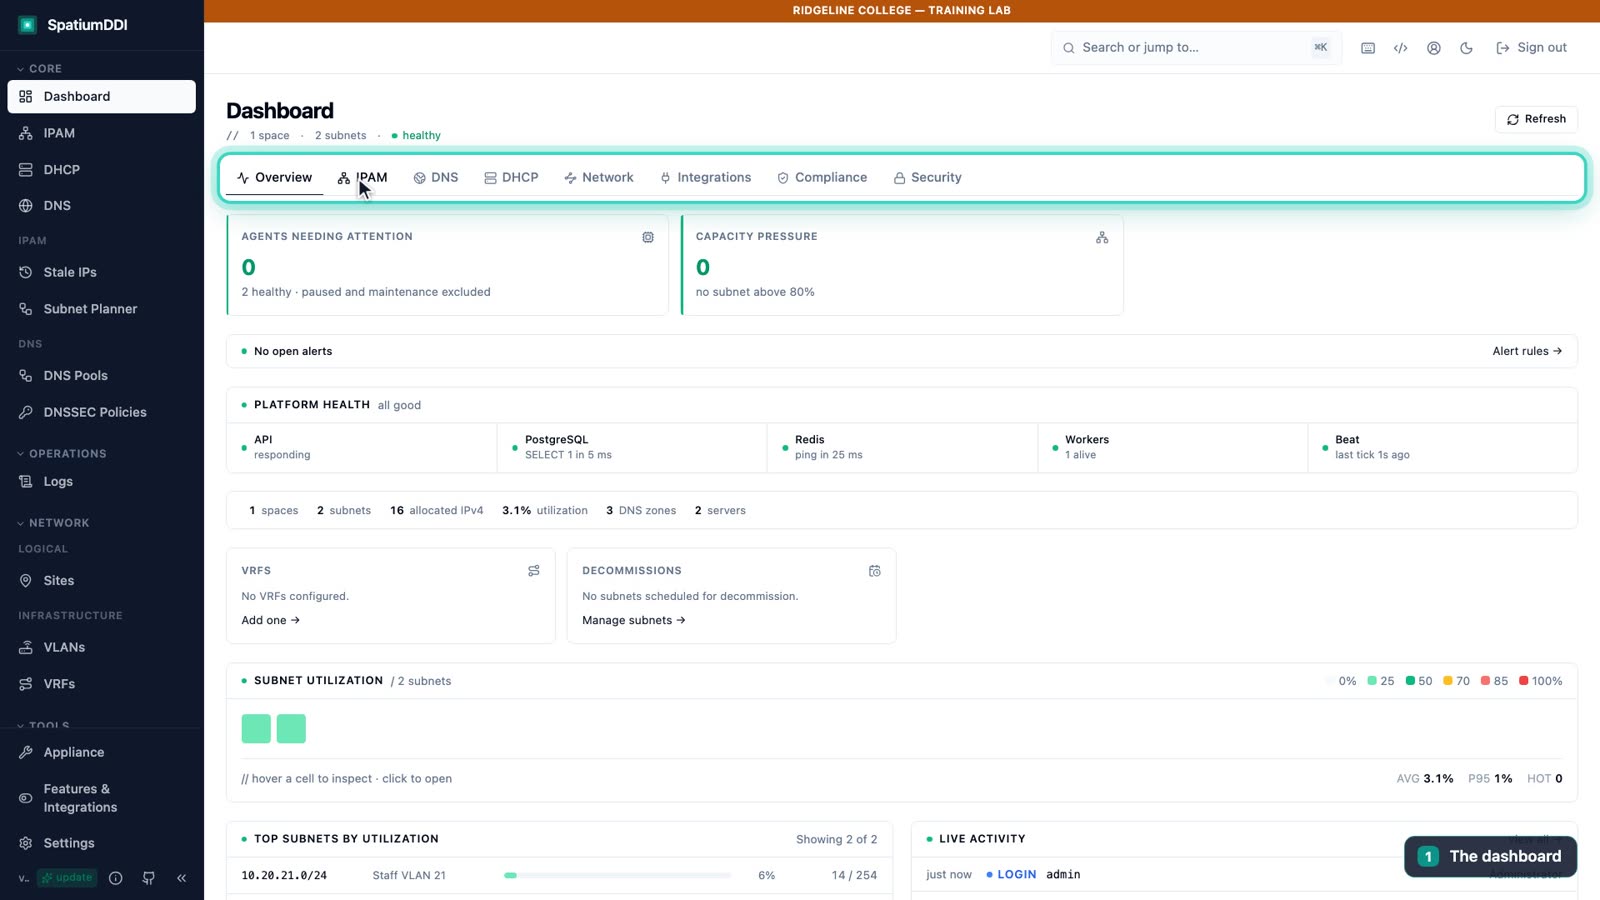
0:12The dashboard is a set of tabs. Overview shows platform health and anything that needs attention. The IPAM, DNS and DHCP tabs roll up each service, and the security and compliance tabs come into play later. Each tab refreshes itself about once a minute.
0:30Platform Health is the first place to look when something feels wrong: the API, the database, Redis, the background workers and the scheduler, each with a live status.
0:41The sidebar groups everything by job. Core holds the three screens you'll use every day: IPAM, DHCP and DNS. Below that come operations, network modelling, tools, reports and administration. Collapse any section you don't need, and expand it again when you do.
1:00The fastest way around is the command palette. Press Ctrl+K (⌘K on a Mac) and type part of a page name. Enter takes you straight there. Later, the same box finds addresses, host names, MAC addresses, subnets, zones and records.
1:18Press the question mark key to see every keyboard shortcut. The list is generated from the same map the application uses, so it never goes stale. Escape closes it.
1:28Features & Integrations lists every optional module. A new installation starts lean: only 16 of the 57 are switched on. A disabled module disappears from the sidebar, from the API, and from the AI copilot, so each deployment only shows what it uses, and switching one off deletes no data. For this course, leave everything as it is.
1:53Two last things in the header. The moon switches between light and dark themes. The code icon opens the API documentation, because every action in this interface is also a REST call, which you'll use in part two.
2:06You now know your way around: the dashboard for status, the sidebar by job, the command palette for speed, and feature modules to keep things focused. Next, you'll set up DNS for Ridgeline College.
The dashboard
Section titled “The dashboard”The dashboard is where you land after signing in. Its tabs roll the platform up by area: Overview, IPAM, DNS, DHCP, Network, Integrations, Compliance and Security. A ninth tab, Conformity, appears once the Conformity evaluations module is on. Security, for example, gathers lockout state, active sessions, audit-chain status and MFA enrollment. Each tab refreshes itself about once a minute, and Refresh updates it on demand.
Overview answers the question “is anything wrong?”:
- Agents needing attention counts DNS and DHCP servers that aren’t healthy. You want 0.
- Capacity pressure counts subnets above 80% utilization.
- The alerts line shows open alerts, with a link to Alert rules →.
- Platform Health gives a live status for the API, PostgreSQL, Redis, the background workers and Beat, the scheduler.
- Below them come counts of what you manage, a heatmap with one cell per subnet, the fullest subnets and live activity.
Some cards appear only with their module: with TLS certificate monitoring on, Certs expiring ≤30d joins the first two.
Platform Health is the first place to look when something feels wrong. If the database or the workers are down, most other symptoms follow from that. Module 2.5 covers the other tabs, the logs and the alert rules.
The sidebar
Section titled “The sidebar”The sidebar groups pages by job. Collapse any section you don’t need, and use Collapse sidebar, the double-chevron icon at the end of the bottom row, to shrink the whole sidebar to icons.
| Section | What’s in it | You’ll use it in |
|---|---|---|
| Core | Dashboard, IPAM, DHCP and DNS, with related pages such as Stale IPs, Subnet Planner, DNS Pools and DNSSEC Policies | Part 1, every day |
| Operations | Logs | 2.5 |
| Network | Sites, VLANs and VRFs on a new installation; customers, providers, circuits, devices and other registries once their modules are on | As needed |
| Tools | The CIDR Calculator, Network Tools and more | 1.8 |
| Reports | Top-N Reports | As needed |
| Administration | Users, groups, roles, API tokens, the audit log, Trash, backups, alerts, and links to the API docs | Part 2 |
| Footer | Appliance, Features & Integrations and Settings, then one row with the version and the About, GitHub and Collapse sidebar icons | 1.2 and here |
An Integrations section appears once you turn an integration on. The footer is always visible, whichever sections you collapse. Its ⓘ icon opens About SpatiumDDI: the running version, the Apache 2.0 license, and the notices for the open-source components inside. Like the rest of the console, it’s for signed-in users only.
Jump anywhere with the command palette
Section titled “Jump anywhere with the command palette”The fastest way around is the command palette. Press Ctrl/⌘+K anywhere, or click Search or jump to… in the header.
- Type part of a page name and press Enter to go there.
- Type an IP address, a hostname, a MAC address, a subnet, a zone or a record to find it. Picking an address opens its subnet with the row highlighted.
- Narrow the search with the chips under the box: All, IPAM, DNS, DHCP, Network and Admin.
- Results respect permissions, so each person finds only what they’re allowed to read.
- Esc closes the palette.
A fresh lab has nothing to find yet. After module 1.7, try typing print-01.
Keyboard shortcuts
Section titled “Keyboard shortcuts”Press ? anywhere outside a text field to open Keyboard shortcuts, a list of the shortcuts you can use, grouped by where they work. The keyboard icon in the header opens the same list. It’s generated from the same map the application uses, so it can’t go stale, and it leaves out shortcuts your permissions don’t allow. Esc closes it.
Feature modules
Section titled “Feature modules”Features & Integrations, in the sidebar footer, lists every optional module with its own switch, and counts how many are on. The modules sit on two tabs, Features and Integrations, grouped by area. Switching a module off removes it from the sidebar, the dashboard, the REST API and the AI copilot’s tools, and stops its scheduled jobs and alert rules, so each deployment shows only what it uses. SpatiumDDI asks you to confirm first, and no data is deleted: switch the module back on and everything is where you left it.
- A new installation starts lean. Only 16 of the 57 modules are on: the core IPAM, DNS and DHCP workflow, conveniences that cost nothing to run, and read-only diagnostics you run by hand. Registries most sites never fill, anything that sends traffic or calls an outside service, and most one-off migration tools ship off. An installation upgraded from an older release keeps the modules it had.
- DNS and DHCP are modules too. Both ship on, and SpatiumDDI refuses to switch one off while it still owns servers, zones or scopes.
- A page that vanished for everyone, the superadmin included, was probably switched off here. Its API answers
404 Not Found, as if the feature weren’t installed, rather than403 Forbidden. - For this course, leave every switch as it is.
The header
Section titled “The header”| Control | What it does |
|---|---|
| Search or jump to… | Opens the command palette (Ctrl/⌘+K) |
| Keyboard icon | Opens Keyboard shortcuts (?) |
| Code icon | Opens the API reference in a new tab |
| Person icon | Opens your account page: change your password, and set up two-factor authentication (module 2.2) |
| Moon or sun | Switches between the dark and light themes. This browser remembers your choice |
| Sign out | Ends your session |
The API documentation
Section titled “The API documentation”Every action in the interface is a REST call, which is what makes SpatiumDDI scriptable (module 2.3). The API documents itself, generated from the build you’re running:
/api/redocis a ReDoc reference. The header’s code icon opens it, and so does API Docs, under Reference in the Administration section of the sidebar./api/docsis interactive Swagger UI, where you can try calls. API Docs (interactive) opens it.- Both load through the web port, so in the lab they’re at
http://localhost:8077/api/redocandhttp://localhost:8077/api/docs. The paths start with/api/, not/api/v1/.
The pages read the API schema with your sign-in, because the schema names every route and the exact version you run. Open them in a browser that’s signed in to SpatiumDDI; signed out, they say “Sign in to SpatiumDDI to view the API documentation.” From a script, fetch /api/openapi.json with an API token; without one, it answers 401. Module 2.3 puts the API to work.
That’s one part of a wider rule: SpatiumDDI tells anyone who hasn’t signed in as little as it can. GET /api/v1/version answers an anonymous caller with "version": "restricted", and the version badge and the About page sit inside the signed-in console.
Knowledge check
Section titled “Knowledge check”Go deeper
Section titled “Go deeper”- IPAM feature specification: §10 covers global search and the command palette
- REST API: the interactive docs, feature-module gating and the version endpoint
- System administration: the About page, what anonymous callers see, the system health dashboard and the platform settings
- Observability: the health endpoints behind Platform Health