

2.5 Dashboards, logs and alerts
Ridgeline’s network team should hear about a full DHCP pool from an alert, not from a queue of students who can’t get online.
SpatiumDDI ships its own dashboards, log views and alerting, so you can watch it without building a monitoring stack first. This module shows what each one tells you, how fresh it is, what it keeps, and which alerts are worth turning on from day one. In the lab you turn on DNS query logging, read the log, and add Ridgeline’s first capacity alert.
What you’ll learn
Section titled “What you’ll learn”- Read the dashboard tabs, and know how fresh their figures are
- Turn on DNS query logging, read the query log, and know how long logs are kept
- Check the control plane itself with Platform Insights and the health endpoints
- Create alert rules and deliver them to syslog, a webhook or email
- Choose between the Prometheus endpoint and the InfluxDB export for long-term metrics
Watch it first
Section titled “Watch it first”The video reads the dashboard, turns on query logging for the default DNS group and reads the queries BIND9 records, adds an alert for subnets above 80%, and ends in Platform Insights. The walkthrough lets you click through the same steps before you do the lab.
Transcript
0:00Module 2.5: dashboards, logs and alerts. Ridgeline's team should hear about a filling subnet from an alert, not from students who can't get online. You'll read the dashboard, turn on DNS query logging, add an alert, and check on the platform itself.
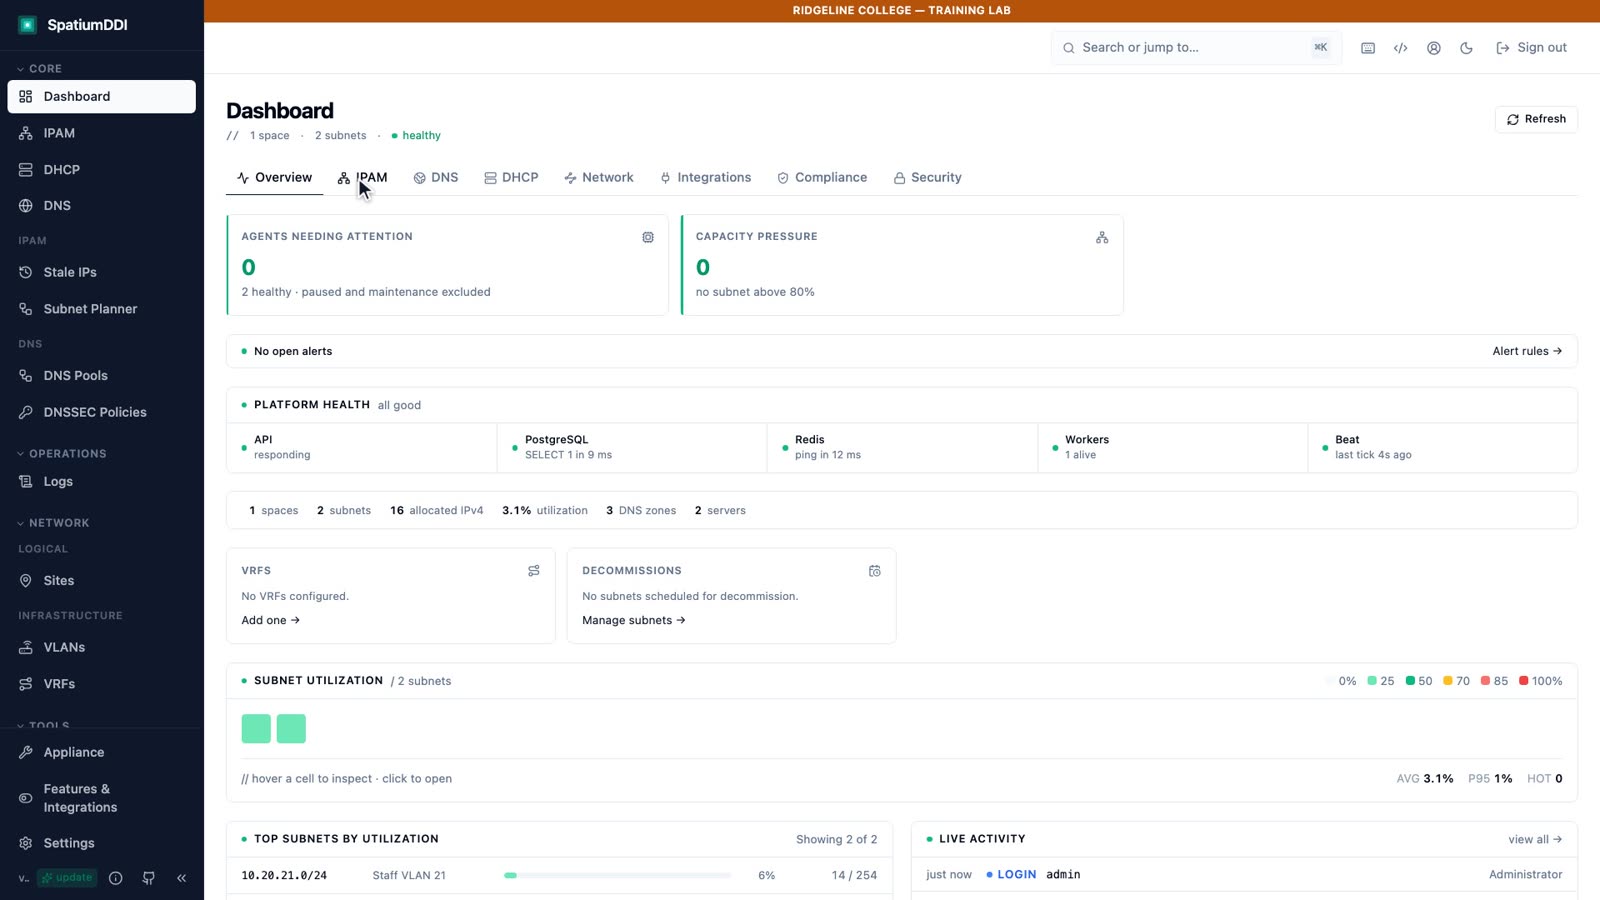
0:17The Overview tab leads with what needs attention: unhealthy agents, subnets running out of space, and open alerts. Platform Health covers SpatiumDDI itself. The IPAM, DNS and DHCP tabs roll up each service, and every tab refreshes about once a minute.
0:36To see which names people actually look up, turn on query logging for the DNS group. Open DNS, the default group, then Options. Under Query Logging, choose Enable and save. Every query is recorded, so in production weigh the volume and the privacy of your users' lookups first.
0:56Ask the server a few questions from a terminal with dig, then open Logs, under Operations. On DNS Queries, each lookup arrives from the agent within seconds: the client, the name and the query type. BIND9 logs the question, not the answer, so the result reads not recorded. Above the list, the analytics show the top names, the top clients and the mix of query types.
1:23Alerts come from rules. SpatiumDDI ships dozens of them for server health, agents, backups and certificates. Add one for capacity: choose New rule, name it for what it catches, keep the rule type, subnet utilization, and set the threshold to eighty percent. Delivery goes to the syslog, webhook or email targets in Settings, Audit Event Forwarding.
1:48Rules run on a schedule. Evaluate now runs them straight away, which is how you test a new rule. Staff VLAN 21 is far below 80%, so nothing fires, and the events list stays all clear.
2:02Finally, Platform Insights shows the control plane from the inside: the database's size and connections, Redis, and the services. After every upgrade, look for Schema at alembic head. It confirms the database migrations finished.
2:17You can now read the dashboard, see the queries your DNS answers, catch a filling subnet before users do, and confirm SpatiumDDI itself is healthy. Next: backups and upgrades.
Dashboards
Section titled “Dashboards”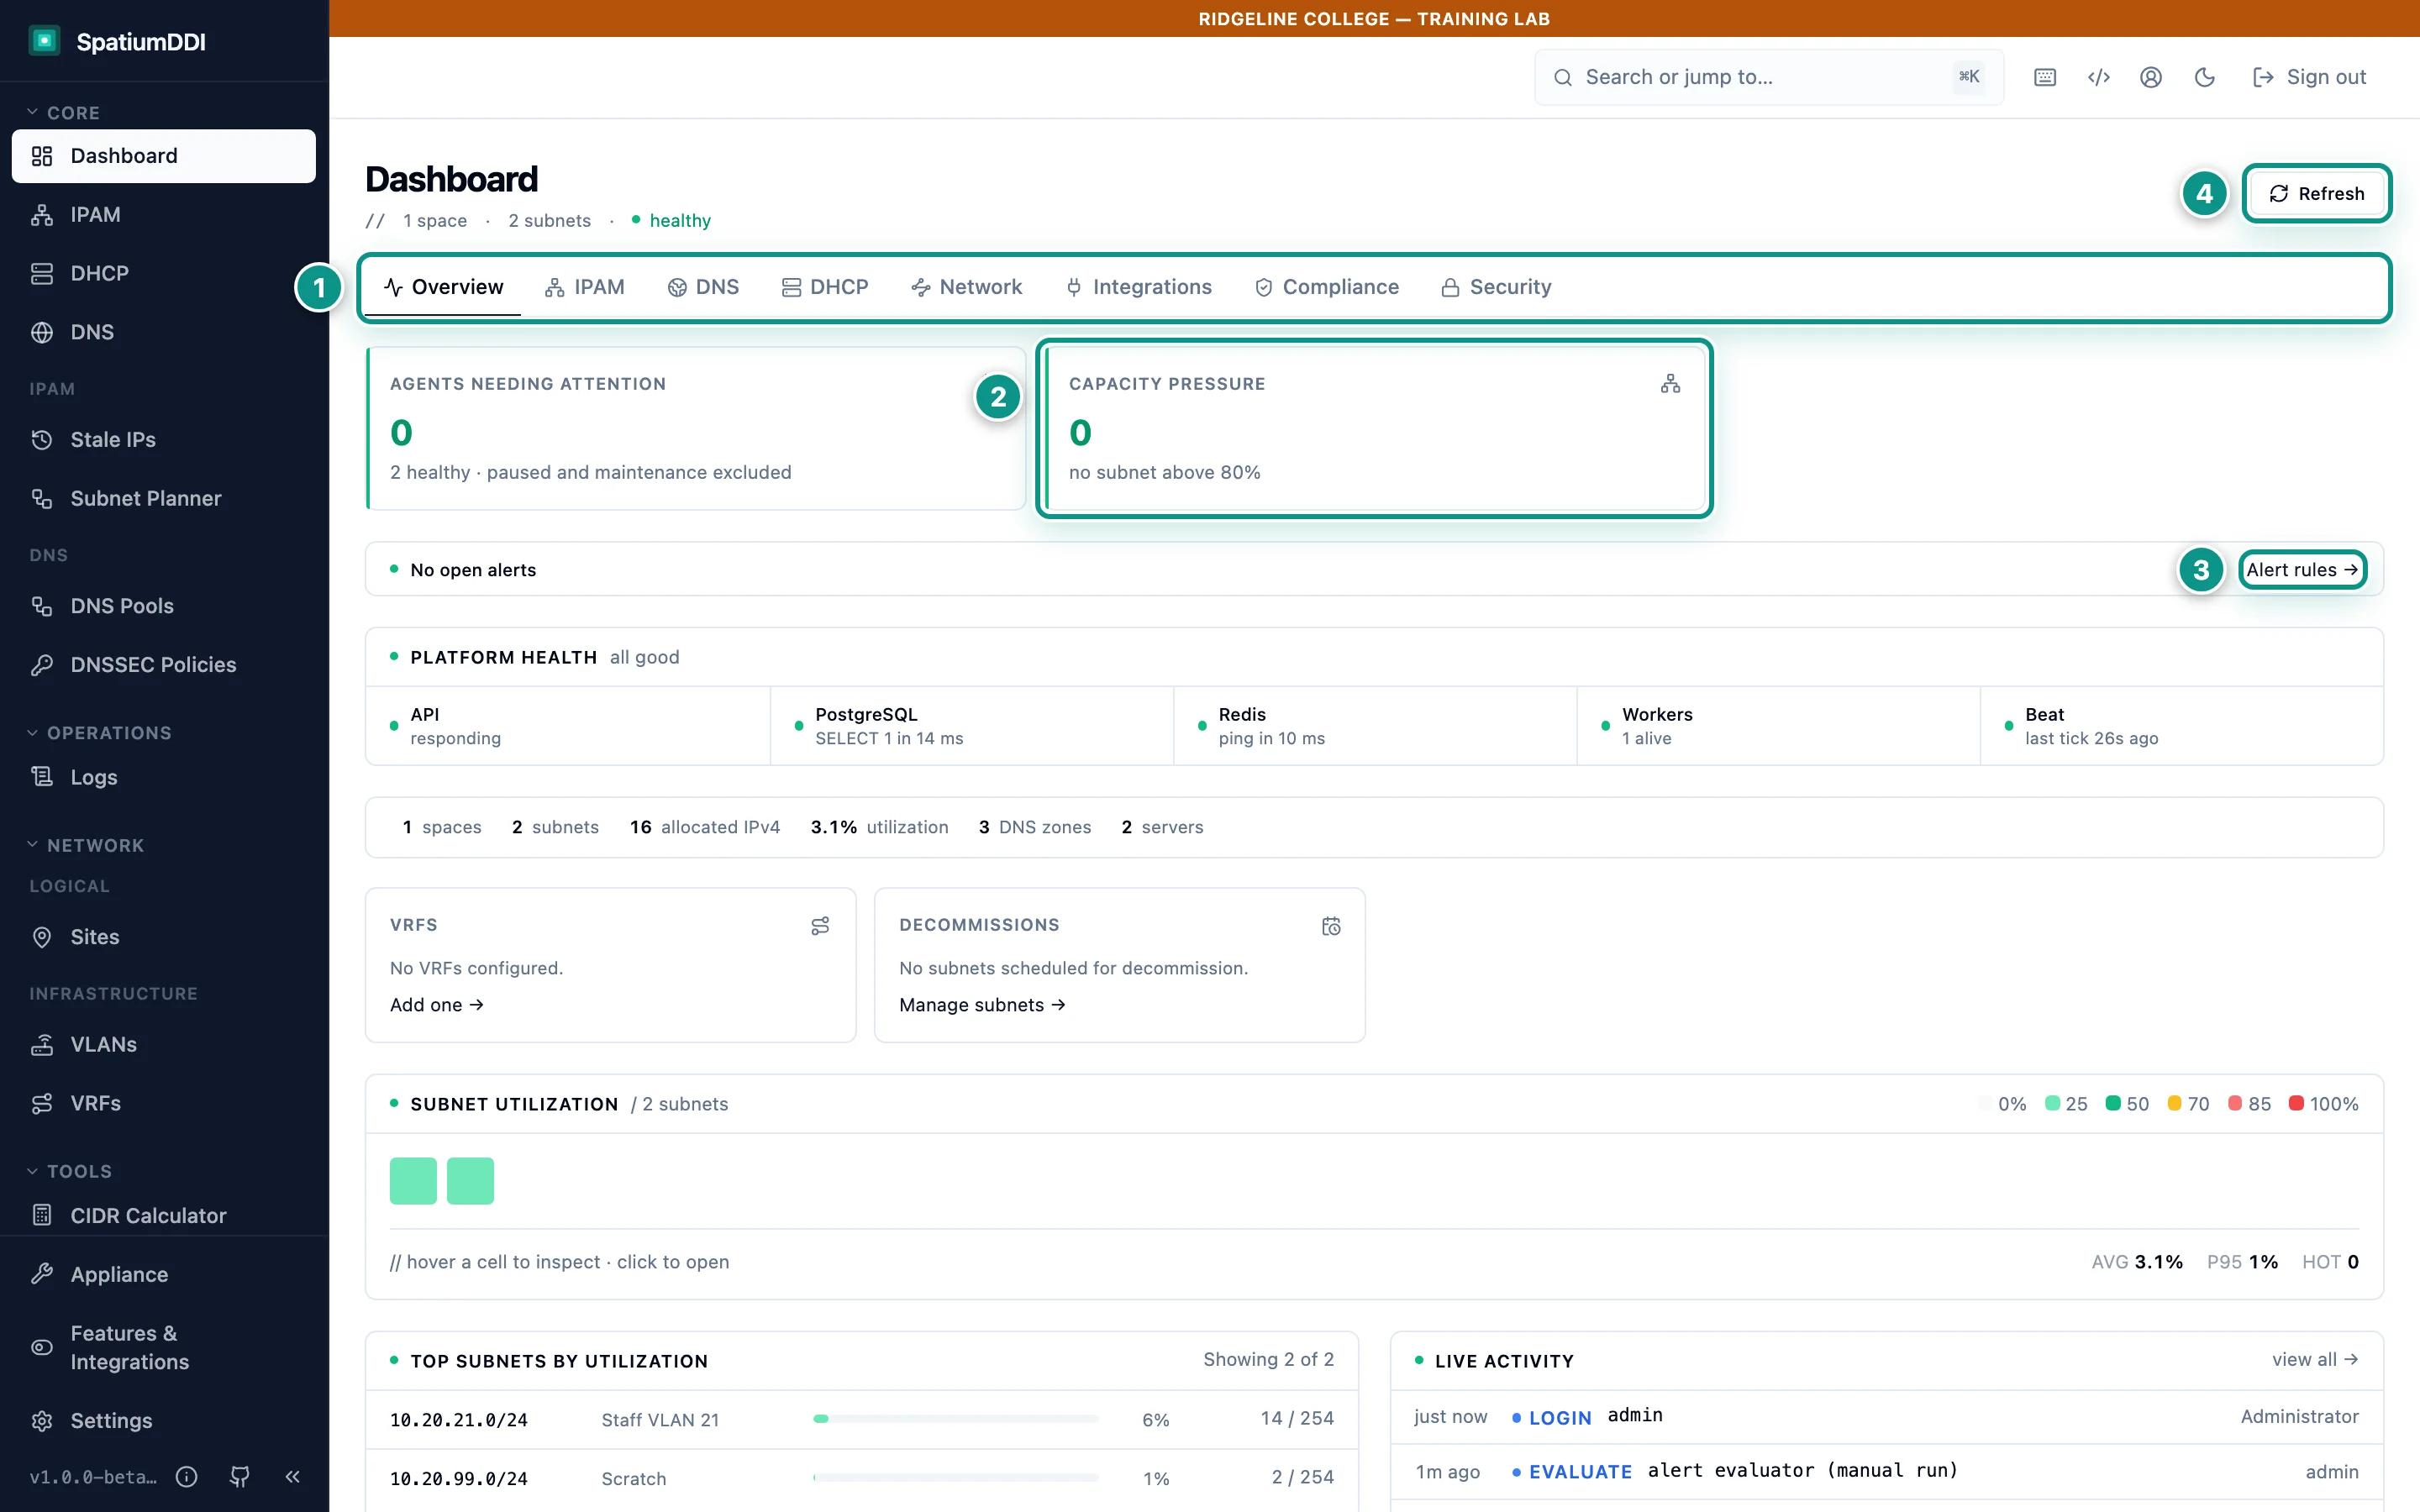
- Area tabs: Overview, IPAM, DNS, DHCP, Network, Integrations, Compliance, Security (Conformity appears when its module is on)
- Capacity pressure: subnets above the utilization threshold
- Open alerts, with a shortcut to the alert rules
- Refresh: dashboards also refresh on their own
The Dashboard has a tab for each area. A new install shows eight: Overview, IPAM, DNS, DHCP, Network, Integrations, Compliance and Security. A ninth, Conformity, appears once you turn on the Conformity evaluations feature module under Features & Integrations.
Each tab is fed by one summary endpoint that refreshes every 60 seconds, so allow up to a minute between a change and the dashboard showing it; Refresh fetches now.
Overview is the page to leave open in a NOC. It leads with what needs attention:
- Agents needing attention: DNS and DHCP servers that aren’t healthy. Paused servers and servers in maintenance are left out.
- Capacity pressure: subnets above 80% utilization.
- Open alerts, with Alert rules → as a shortcut to the rules.
- Platform Health: the API, PostgreSQL, Redis, the workers and the scheduler (Beat).
- A subnet utilization heatmap. Hover over a cell to inspect it, click to open the subnet.
- Certs expiring ≤30d, once the TLS certificate monitoring module is on: monitored certificates close to expiry.
A wall display needs one more decision. The idle timeout from module 2.2 signs out a console nobody touches after 60 minutes, and the dashboard’s own refreshes don’t count as activity. Setting Session Timeout to 0 keeps the display signed in, but it turns the timeout off for every browser session, so weigh that against an unattended, signed-in console.
The DNS and DHCP tabs chart query rates and DHCP traffic from the agents’ own statistics, with no Prometheus needed. Security shows two-factor coverage among local accounts, API tokens close to expiry, failed sign-ins and recent permission changes; Network, Integrations, Compliance and Conformity cover the matching features.
Settings → Utilization Thresholds sets where utilization bars turn to the warning and critical colors: 80% and 95% by default. Very small subnets (IPv4 prefixes longer than /29 by default) are left out of utilization reporting, so point-to-point links don’t raise false alarms.
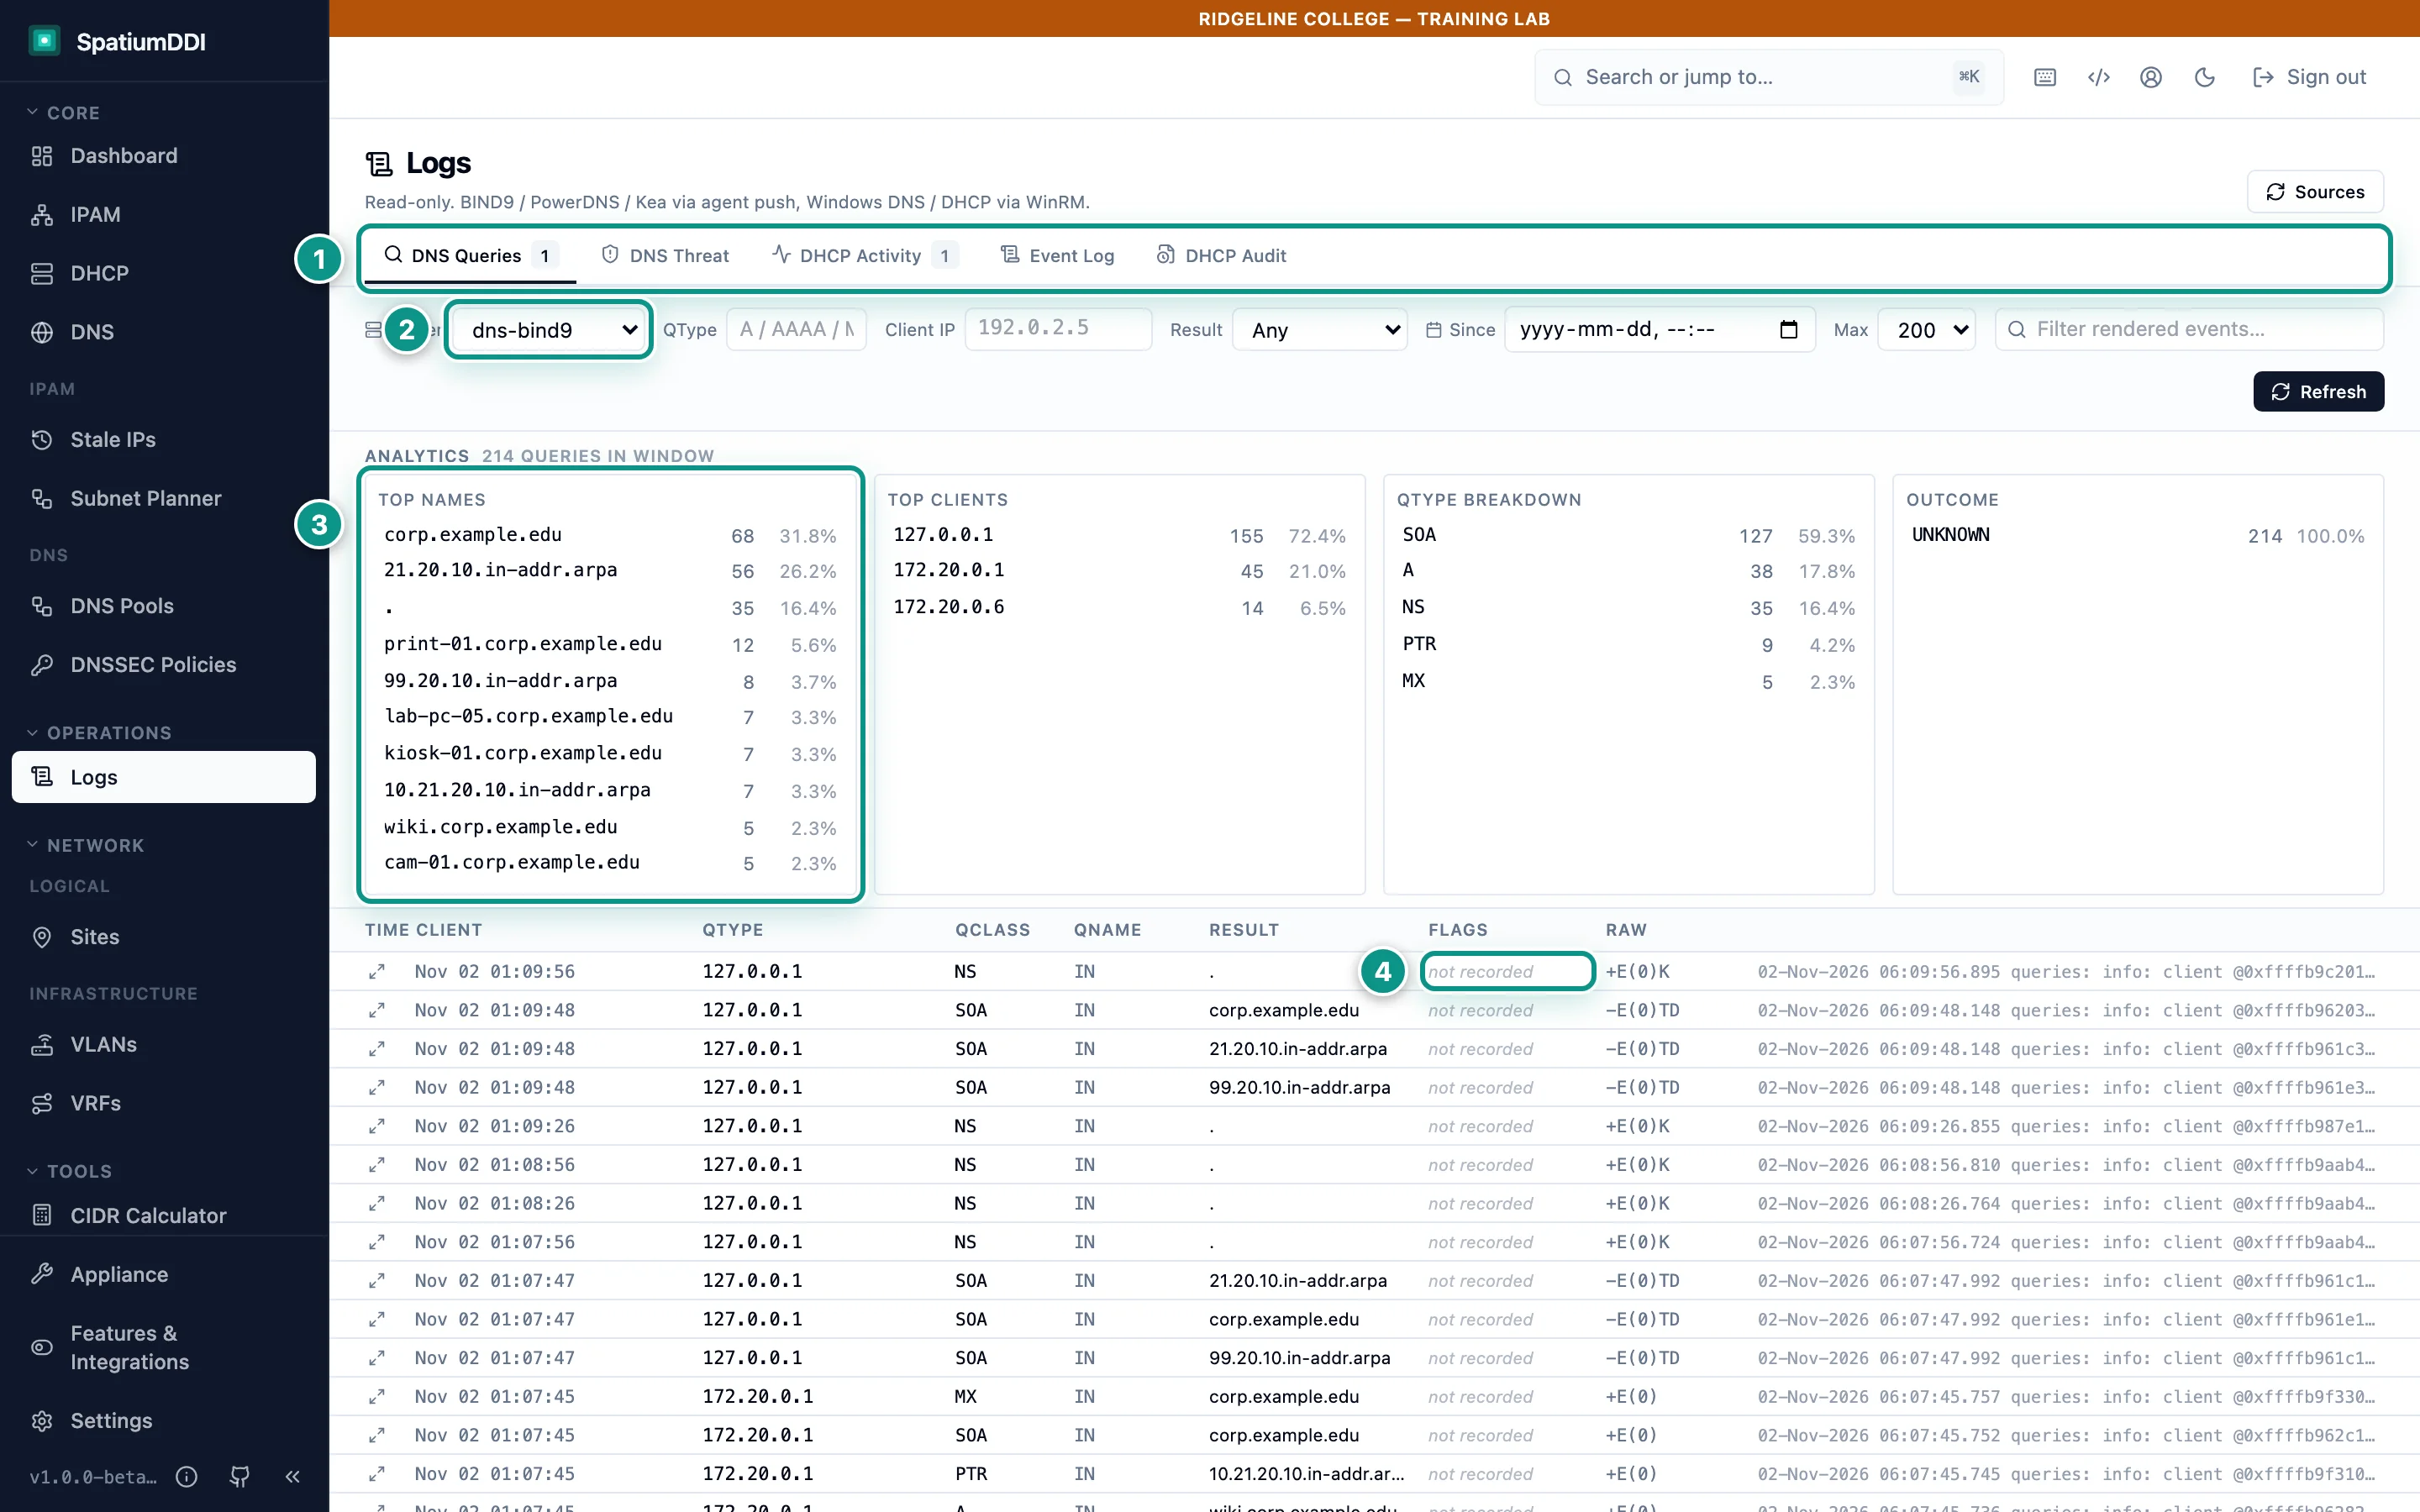
- Views: DNS queries, DNS threat, DHCP activity, event log and DHCP audit
- Filters: server, query type, client IP, result and time window
- Analytics: top names, top clients and query types in the window
- BIND9 logs the question, not the answer: Result reads “not recorded”
Logs (under Operations in the sidebar) is read-only. BIND9, PowerDNS and Kea logs arrive through agent push; Windows DNS and DHCP logs are read over WinRM on demand.
| View | Shows |
|---|---|
| DNS Queries | Query log lines from BIND9 or PowerDNS: time, client, query type and name |
| DNS Threat | Detections over the query log (tunneling, DGA names, beaconing, RPZ hits by client). It needs the default-off DNS threat analytics feature module (security.dns_threat) |
| DHCP Activity | Kea DHCPv4 activity: DISCOVER, OFFER, REQUEST, ACK, lease events |
| Event Log | The Windows DNS and DHCP event logs, read live |
| DHCP Audit | Windows DHCP’s per-lease audit trail |
Filters narrow by server (one server, a whole server group or all servers), query type, client IP, result, a start time and a maximum number of events. The analytics strip shows the top names, the top clients and the query-type breakdown for the window, and the Sources button refreshes the list of servers that send logs.
Turning on DNS query logging
Section titled “Turning on DNS query logging”DNS query logs arrive only once you turn on query logging for the DNS server group, and it’s off on every group by default. Open DNS, select the group, open its Options tab, tick Enable under Query Logging and click Save Changes. Within seconds the agent starts shipping BIND9’s query log. Technitium isn’t supported yet.
Think before you leave it on in production. The form itself warns of high volume, and every name your users look up is recorded, which can say a lot about them.
BIND9’s query log records the question, not the answer, so each row’s result reads “not recorded”, which never means the lookup succeeded. To record the answer too, tick Record the outcome of each query under Query Logging (BIND9 only, off by default). It adds the response code and answer count to each row, and roughly doubles the log volume, so treat it as a troubleshooting switch.
Agent-pushed entries are kept for 24 hours by default, and Settings → Data Retention → DNS query & DHCP activity logs stretches that to a week at most: the Logs page is for triage, not history.
The control plane’s own logs (api, worker, beat) go to the containers’ standard output as JSON; read them with docker compose logs -f api worker, and ship them to your own collector (ELK, Loki, Splunk and the like) for retention. No log store is bundled.
Platform Insights and health checks
Section titled “Platform Insights and health checks”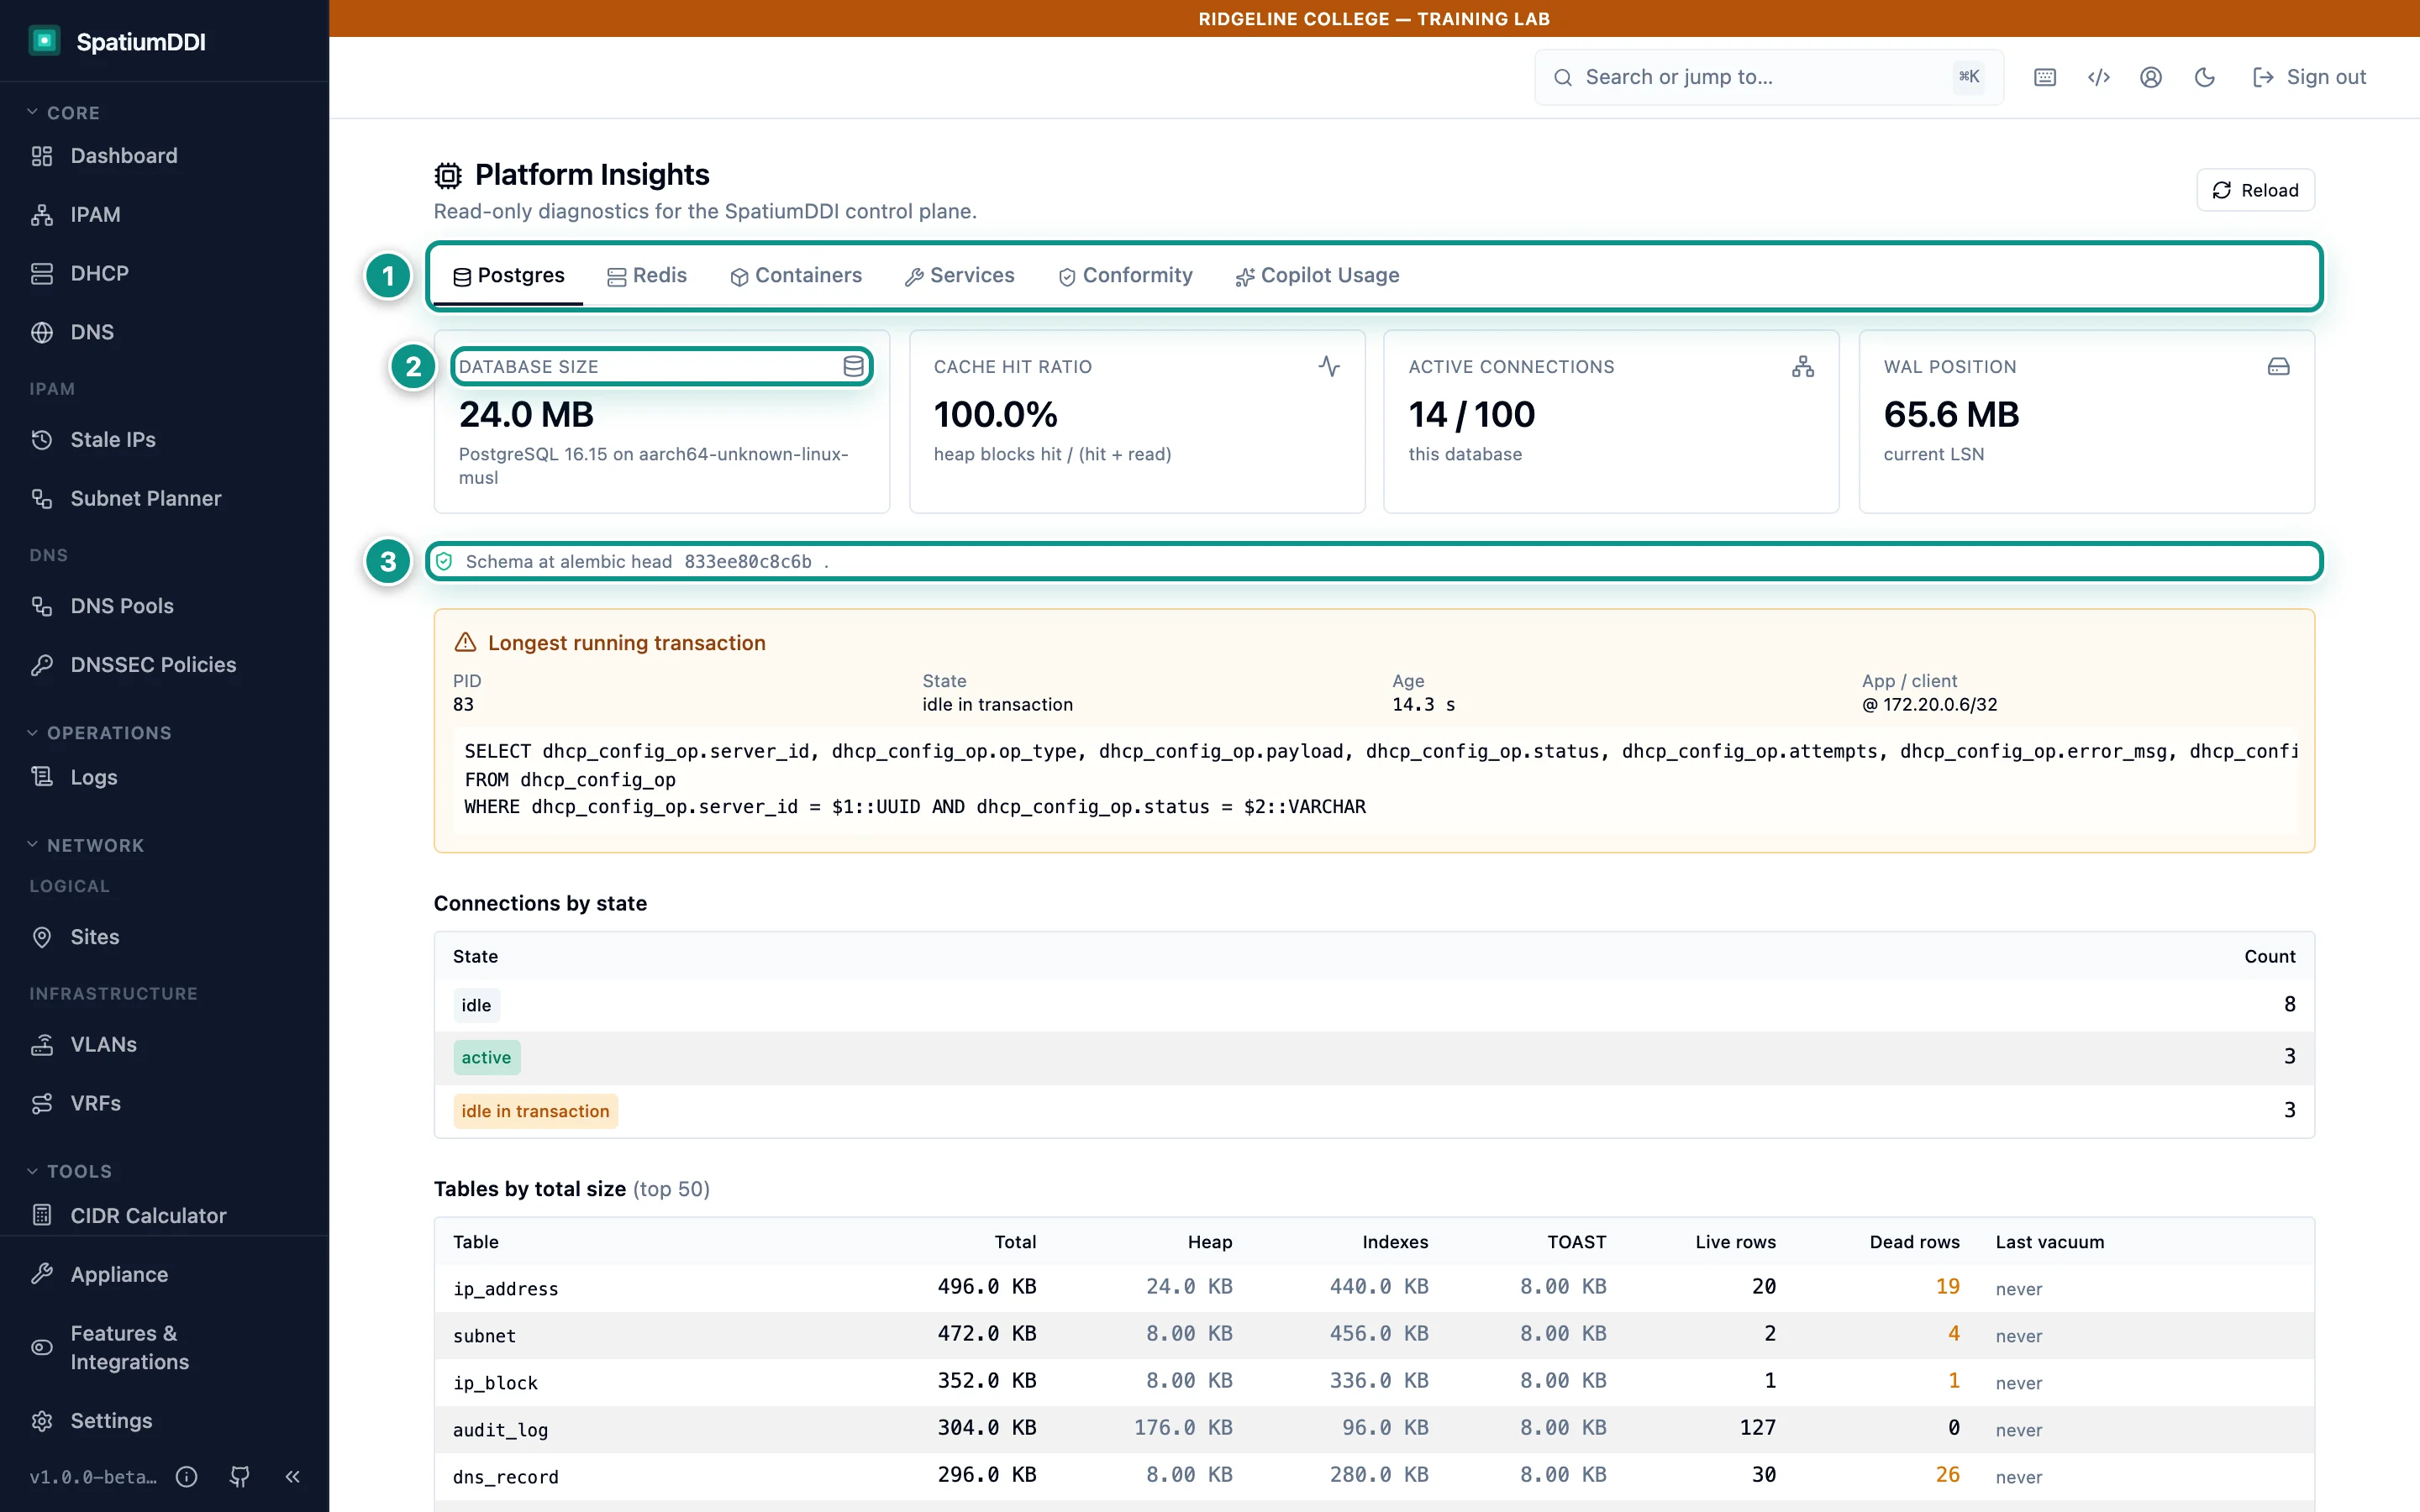
- Tabs: Postgres, Redis, containers, services, conformity and Copilot usage
- Database size, cache hit ratio and connections at a glance
- Schema at alembic head: confirms migrations ran after an upgrade
Platform Insights (Administration → Platform Insights, superadmins only) is a read-only view of the control plane itself:
| Tab | What it shows |
|---|---|
| Postgres | Database size, cache hit ratio, connections, WAL position, the longest-running transaction, table sizes, and slow queries when pg_stat_statements is installed. Schema at alembic head confirms that migrations ran after an upgrade |
| Redis | Memory, clients, keyspace, and the bus that wakes agents when their config changes |
| Containers | CPU, memory, network and disk I/O per container. It needs the Docker socket mounted into the api container; without it, the tab shows a setup hint |
| Services | The control-plane services. Start, stop and restart controls exist, but they’re off by default everywhere except the appliance |
| Conformity, Copilot Usage | The latest conformity rollup, and Operator Copilot usage |
Load balancers and monitoring probes use the health endpoints on the API, which need no sign-in:
| Endpoint | Answers | Use it for |
|---|---|---|
/health/live |
200 while the process is up | Liveness: restart the container if it fails |
/health/ready |
200 only when the database and Redis respond and the schema is at the head the build expects | Readiness and load balancers |
/health/platform |
Always 200, with an ok or degraded rollup; the per-component list needs a signed-in caller |
Dashboards; don’t use it as a probe |
Administration → Diagnostics collects errors the control plane caught, for bug reports; it’s worth a look when something misbehaves.
Alerts
Section titled “Alerts”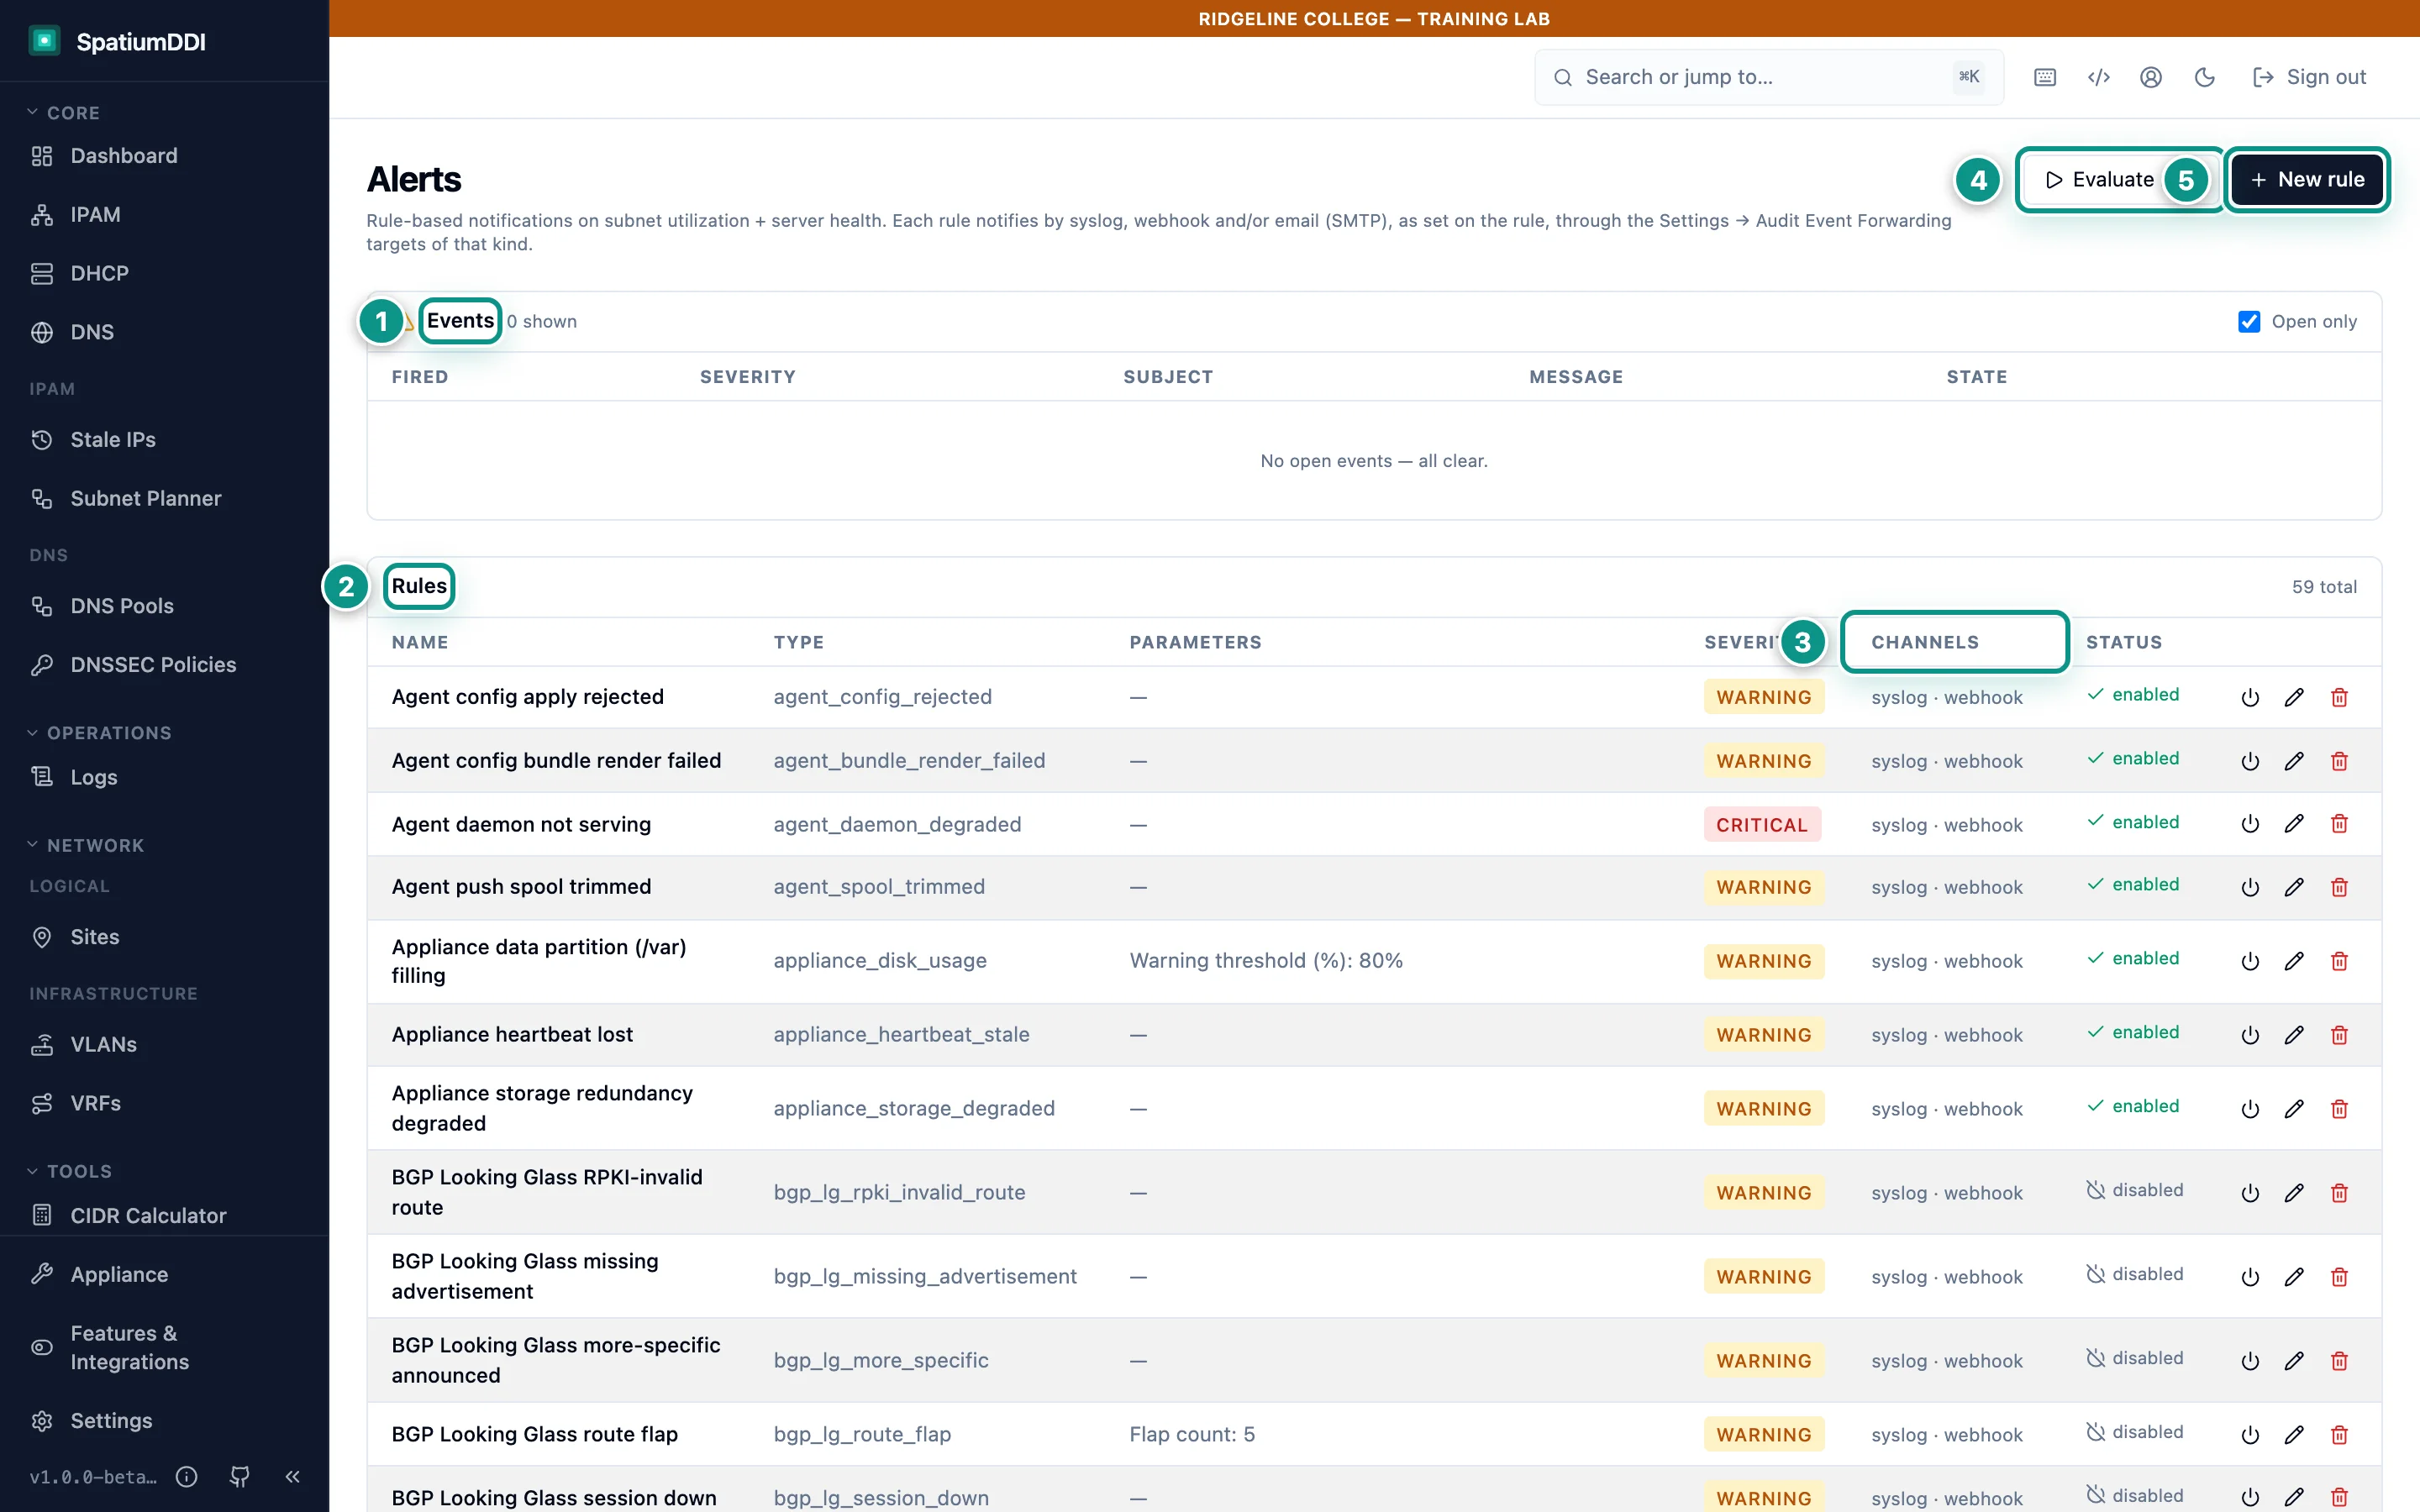
- Open events: what is firing right now
- Rules: SpatiumDDI ships with a full set, all editable
- Channels: syslog, webhook (Slack / Teams / Discord) and email
- Evaluate now instead of waiting for the next sweep
- New rule, for example subnet utilization ≥ 80%
Administration → Alerts is SpatiumDDI’s rule engine. An evaluator runs every 60 seconds: when a rule matches, it opens an event; when the condition clears, the event resolves by itself. Evaluate now runs a pass immediately, which is how you test a new rule.
A superadmin can also Resolve a known-noisy event by hand. It stays resolved, and nothing more is delivered for it, until the condition clears; if the condition comes back after that, a new event opens. Writing rules, Evaluate now and Resolve are superadmin-only, while every built-in role can read the rules and events.
The Events table shows what’s firing (untick Open only for history), and the Rules table lists the rules. A new install has 58 built-in rules, for server and agent health, backups, credentials, DNS and more, but none for subnet utilization: that one is yours to add, and the lab does. Some built-in rules are on from the start, such as Agent config apply rejected; others, such as the BGP rules and most of the DNS-anomaly rules, ship disabled.
Three built-in rules watch your backups, and all three are on from the start. Scheduled backup failed and Scheduled backup stale cover every backup target with a schedule, and Backup restore drill failed covers targets with scheduled drills (module 2.6). Credential expiring or rejected, also on, warns 30 days before an API token with an expiry, a certificate or another credential SpatiumDDI depends on runs out.
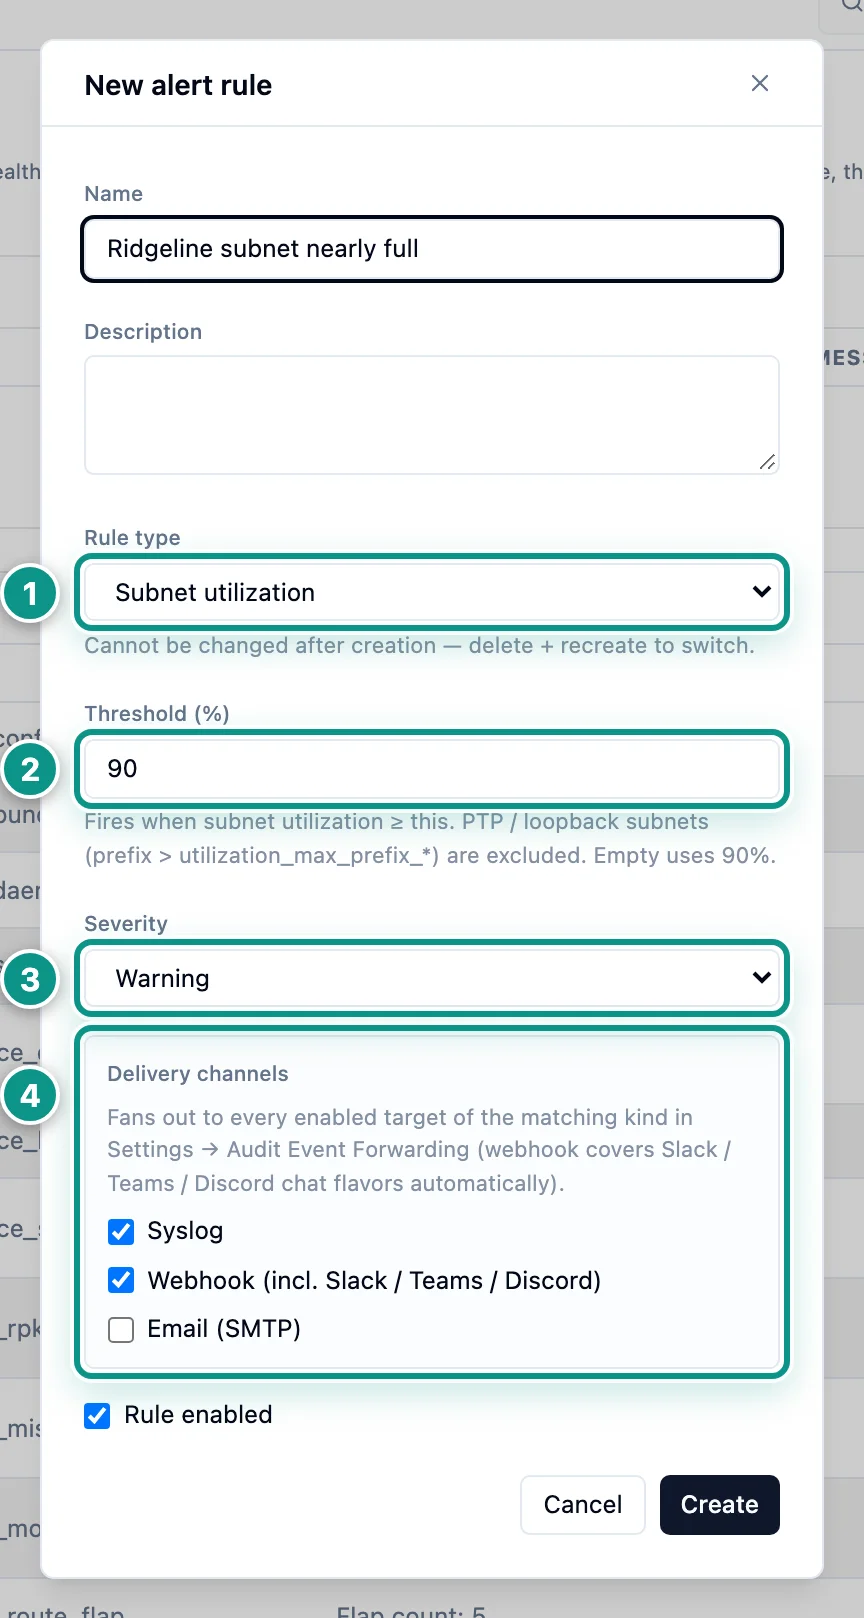
- Rule type is fixed once created: delete and recreate to change it
- Threshold: fires when utilization reaches this percentage
- Severity
- Delivery goes to the targets configured under Settings → Audit Event Forwarding
New rule asks for a Name, an optional Description, the Rule type, the type’s parameters (for Subnet utilization, a Threshold (%) that defaults to 90), a Severity (Info, Warning or Critical), the Delivery channels and Rule enabled. The Rule type list offers only types whose feature module is on. Choose the type carefully: it can’t be changed after creation, so switching means deleting and recreating the rule.
Alerts don’t have their own destinations. Each delivery channel (Syslog, Webhook (incl. Slack / Teams / Discord), Email (SMTP)) fans out to every enabled target of that kind under Settings → Audit Event Forwarding, the same targets that forward the audit log (module 2.4). Set up a target first, or your alerts go nowhere.
A target’s test button (the play icon) sends a synthetic event shaped like an audit row, with the severity filter off. It proves SpatiumDDI can reach the target, not that alerts get through, so confirm delivery with a real alert event. If you upgraded from 2026.09.04-1 and a target has a Minimum Severity, expect alerts you never received before: until 2026.10.02-1 that filter dropped every alert (#1031).
What to alert on at Ridgeline
Section titled “What to alert on at Ridgeline”A starter set, built from rule types that exist in this release. Check the Rules table first: where a built-in rule of that type exists, enable or edit it rather than adding a duplicate.
| Watch for | Rule type | Suggested setup | Why |
|---|---|---|---|
| A subnet filling up | subnet_utilization |
Warning at 80% (Lab 12), Critical at 95%: two rules | Lab and staff VLANs fill up at the start of term; 80% matches the dashboard’s capacity-pressure card |
| A DHCP pool running dry | dhcp_pool_exhaustion |
Critical | Clients can’t get an address. Reservations count as used, so the pool can be “full” with few leases |
| A DNS or DHCP server down | server_unreachable |
Critical | A DNS agent is marked unreachable after 90 seconds without a heartbeat |
| A config the daemon rejected | agent_config_rejected |
Built in and on: keep it | The agent keeps serving its last good config, so nothing else looks wrong |
| Scheduled backups that fail or stop | backup_failed, backup_stale |
Built in and on: keep them | backup_stale also fires when a stopped worker or scheduler means no backup runs at all |
| Backups that won’t restore | restore_drill_failed |
Built in and on: schedule drills (module 2.6) | It only watches targets that have scheduled drills |
| Tokens and certificates about to expire | secret_expiring |
Built in and on (Credential expiring or rejected, 30 days): keep it | It covers API tokens with an expiry, so the 90-day ridgeline-automation token warns you before it stops working |
| Addresses nobody uses | stale_ip_count |
Info, optional | Reclaim candidates; it needs “last seen” data from discovery |
Tick Syslog on every rule so your SIEM keeps the history, and add the webhook channel (the NOC’s chat, for example) only on the Critical rules. A channel reaches every enabled target of its kind, so plan your forwarding targets with that in mind.
Exporting metrics
Section titled “Exporting metrics”For long-term trends and your own dashboards, send metrics to a time-series database. Neither path comes with bundled Grafana dashboards.
Prometheus. The API serves /metrics, on by default (the prometheus_metrics_enabled setting), and it answers only a bearer token: the scrape token you set as PROMETHEUS_METRICS_TOKEN in .env (the Helm chart generates one), or any valid API token. Without a token it answers 401. The web port proxies /metrics too (http://localhost:8077/metrics in the lab), so treat the token as a secret. A dedicated read-only API token for each scraper can be revoked without touching anything else.
The endpoint carries API request metrics (spatiumddi_api_requests_total, a request-duration histogram and spatiumddi_api_active_requests), the DNS agents’ config-bundle counters and the standard process metrics. IPAM, DNS and DHCP metric families are planned, not emitted. A scraper that read /metrics without credentials before 2026.10.02-1 gets 401 after the upgrade until you give it a token.
InfluxDB. Settings → Metrics → InfluxDB Export pushes to InfluxDB v1, v2 or v3, which also works when the control plane sits behind NAT. It sends DNS query and DHCP message counts in 60-second buckets, plus subnet utilization and DHCP scope lease gauges.
Each InfluxDB target has its own push interval (60 seconds by default, 30 at the least), and Test makes a real write rather than a connectivity check. Only superadmins can configure it. The Observability guide has Flux queries for Grafana.
A five-minute morning check
Section titled “A five-minute morning check”Alerts tell you when something crosses a line; a short daily look catches what drifts slowly. A routine for Ridgeline’s NOC, using only what Part 2 covers:
- Dashboard → Overview: no agents needing attention, no surprise in Capacity pressure, and Platform Health all good.
- Administration → Alerts: no open event without an owner, and no open backup alert. Resolve an event by hand only once you know why it fired.
- Administration → Backup → Restore Drills: every target’s Last proven date is within the past week.
- Administration → Audit Log: set the Result filter to
denied, then tofailurefor failed sign-ins. - Administration → API Tokens: nothing that a script still needs is about to expire, and no token is set to Never without a reason.
Hands-on lab
Section titled “Hands-on lab”Dashboards, logs and alerts
You will:
- Turn on DNS query logging for the default group
- Send BIND9 a few queries and read them in the query log
- Add an alert rule for subnets above 80%, and run the rules at once
- Confirm in Platform Insights that the database schema is up to date
Before you start: Sign in as admin: only a superadmin can change a DNS group's options or create alert rules. Labs 2, 3 and 5 must be done, so that the zone, Staff VLAN 21, print-01 and cam-01 exist. You need dig in a terminal, as in Lab 2.
-
Open DNS, select the group
default, and open its Options tab. -
Under Query Logging, tick Enable, leave Record the outcome of each query clear, and click Save Changes.
-
Wait about ten seconds for the change to reach BIND9, then ask it a few questions from a terminal. The first two print an address and the last prints the zone’s SOA record;
wikidoesn’t exist, so it prints nothing, but it’s logged all the same:Terminal window dig @127.0.0.1 -p 1053 +short print-01.corp.example.edudig @127.0.0.1 -p 1053 +short cam-01.corp.example.edudig @127.0.0.1 -p 1053 +short wiki.corp.example.edudig @127.0.0.1 -p 1053 +short corp.example.edu SOA -
Open Logs under Operations in the sidebar, and click the DNS Queries tab. Your queries arrive within about ten seconds: click Refresh if they aren’t there yet, and run the
digcommands again if the list is still empty after a minute. Each row shows the time, the client, the query type and the name. -
Look at the result values. Every row reads “not recorded”, the
wikilookup included, because BIND9 logged the questions, not the answers. In 1.0.0-beta.3 the column headings sit one column to the left of their values, so “not recorded” appears under Flags and the name under Result. Above the list, the analytics count the queries in the window and show Top names, Top clients and the QType breakdown. -
Open Administration → Alerts and click New rule.
-
Enter the Name
Ridgeline subnet above 80%. Keep Rule type at Subnet utilization and set Threshold (%) to80. Leave Severity at Warning, the Delivery channels as they are and Rule enabled ticked, then click Create. The lab has no forwarding targets, so this rule’s alerts don’t go anywhere yet. -
Click Evaluate now. Your rule is listed in the Rules table, and it opens no event for Staff VLAN 21, which is far below 80%.
-
Open Administration → Platform Insights. On the Postgres tab, find Schema at alembic head, followed by the revision the database is at (
833ee80c8c6bon 1.0.0-beta.3). It confirms that this release’s migrations ran to the end.
The query log keeps its entries for 24 hours, so if you run ./lab/check.sh 12 on a later day, run the dig commands from step 3 again first.
./lab/check.sh 12Knowledge check
Section titled “Knowledge check”Go deeper
Section titled “Go deeper”- Observability: the log viewer, the audit log and its forwarding targets, metrics and the scrape token, health endpoints and the alerting framework
- DNS features §21: query outcomes, and what Record the outcome of each query adds to the query log
- System administration §0, §2.7 and §8: Platform Insights, the data retention settings and the InfluxDB export
- Permissions model: the
alertresource type, and which alert actions stay with superadmins - REST API §1: the health and metrics endpoints outside
/api/v1 - Scraping /metrics needs a token (#1159): why anonymous scrapes stopped working in 2026.10.02-1
- Troubleshooting: celery-beat is unhealthy: reading a red Beat
- DHCP features: pool occupancy, which the pool-exhaustion alert uses